

Today’s free competition markets allow not only unlimited amount of market participants, labor and resources flexibility, but also a possibility to exit market and stop the activities of the company or organization by some specific reasons. The institution of bankruptcy is a system of procedures for the settlement of insolvent entity’s debts, by applying bankruptcy proceedings and rehabilitation measures. The main purpose of the bankruptcy procedures application is to exclude inefficient participants from the market, and early involvement to some other market operations debtors’ capital and human resources, in order to avoid the problem of inefficiency and waste of resources. Bankruptcy institution is an important part of market economy system, which affects the behavior of economic subjects and enhances competition. So far, the studies on insolvency assessment models are not presented widely in Kazakhstan. Only few authors investigated into that topic, moreover, no international insolvency assessment model was adopted for Kazakhstan economic environment.
The goal of this paper is the evaluation of foreign models application and development of
methodological framework for the most effective insolvency risk assessment for non-financial organization in conditions of Kazakhstan’s economy. The main objectives are:
– Analyze the financial, economic and legal aspects of the insolvency related process in Kazakhstan;
– Analyze insolvency prediction indicators and models, scientific works and studies introduced by foreign and Kazakhstan scientists;
– Apply bankruptcy prediction models of three different classes in practice on the example of Kazakhstan enterprises and draw conclusions and perform qualitative evaluation of those models’ effectiveness and accuracy.
The object of the study are non-financial enterprises of Kazakhstan, therefore the subject is the verification of 5 insolvency risk assessment models. From that 5 models 3 are discriminant analysis models (Altman Z, Z′China, Z″Japan) [1, 2, 3, 7], one logit-probit class model (Ohlson) [11] and one naïve model (David Durand) [6]. There are two hypothesis of the study (H1, H2) – Insufficient values of liquidity coefficients are the signals for the mangers to start insolvency investigation process (H1), insolvency risk assessment models introduced by foreign investigators have to be checked and verified to be used for the domestic enterprises’ insolvency risk assessment (H2).
Review of scientific literature
Early models used to predict companies’ bankruptcy were based on the financial ratio analysis using univariate and multivariate statistics methods. A univariate approaches investigates the relationship of some individual ratios and the insolvency. Such approaches were not efficient enough; moreover they were able to predict the case of bankruptcy with limited accuracy and in a very close period before bankruptcy. The multivariate approach uses the polled financial ratios for the insolvency prediction. For the efficient construction of multivariate model for the bankruptcy prediction it is vital to determine which financial ratios should be used and how they should be weighted.
In the work of M.F. Salakhiyeva [12] insolvency prediction models are classified in the various ways, author used offered classification and with some minor changes this classification is showed in a Table 1. This table represents classification of bankruptcy prediction models according to several criteria as in the article of M.F. Salakhiyeva. Next milestone of the insolvency related studies was the logistic regression analysis which is equivalent to the two-group discriminant analysis.
Table 1
Classification of the assessment models
|
Model |
Classification features |
||||
|
Geography of the origins |
Application horizons |
Scale of the forecasted enterprise |
Formalization level |
Data processing type |
|
|
Altman |
Developed in a country with market economy |
Distant, long-term |
Enterprises of any size |
Qualitative, Statistical, Discriminant |
No need in special software |
|
D. Durand |
Developed in a country with market economy |
Distant, medium-term |
Enterprises of any size |
Qualitative, Statistical, Scroing |
No need in special software |
|
Kralicek |
Developed in a country with market economy |
Distant, long-tern |
Enterprises of any size |
Qualitative, Statistical |
No need in special software |
|
J. Ohlson |
Developed in a country with market economy |
Distant, medium-term |
Enterprises of any size |
Qualitative, Statistical, Discriminant |
No need in special software |
|
Scoring models |
Developed in a country with market economy / Developed in a country with transition economy |
On place, medium-term |
Enterprises of any size |
Mixed, scoring models |
Requires special software |
Note. Set up by authors, on the basis [12].
The logistic procedure fits linear logistic regression models for binary or ordinal response data using Maximum Likelihood estimations and compares the estimated samples using Wald chi-square. The Maximum Likelihood procedure is used in an iterative manner to identify the most likely estimates for the coefficients. The Wald statistic is used to test the hypothesis that a coefficient varies from zero [8].
There are many specific probabilistic choice models, and two of the most widely used models are the multinomial logit (MNL) and multinomial probit (MNP) models. Logistic regression analysis has the advantage of being less affected than discriminant analysis, when basic assumptions, such as the normality of the variables are violated.
Further, Recursive Partitioning Algorithm (RPA) followed. Recursive Partitioning Analysis is a nonparametric technique, which minimizes the expected cost of misclassification by a univariate splitting procedure [8]. However, RPA does not provide the probabilities of group membership, or a means for evaluating the significance of variables.
Finally, Artificial Neural Networks (ANN) is the latest bankruptcy prediction model. An artificial neural network system (ANN) is a computer algorism which can be ‘trained’ to imitate the cellular connections in the human brain. It consists of a large number of interconnected elementary processing units to compute data. The network’s processing results are derived from the collective behavior of its units and are dependent on how the units interact with each other. By processing and evaluating the interactions in a complex set of prior data, a neural network attempts to assign proper weights to the respective inputs to allow for the correct deduction of the ultimate outcome. These input weights are aided by a ‘genetic algorithm’ optimization procedure, which simulates the model’s predictive power under a large number of scenarios and allows the best weighting schemes to survive and reproduce from one generation to the next.
Research methodology
This chapter deals with insolvency statistics and describes general characteristics and methods of the research. In the years 1993–1994 level of inflation in Kazakhstan and other post-Soviet countries went up to catastrophic values. Prices on raw materials grew up significantly and at the same time supply fell dramatically. During the period of time enterprises accumulated huge debts to banks, consequently amounts of interest payments and penalties increased as well, moreover debts to government budget and non-budget organizations rocketed. Nevertheless, management of companies continued to take borrowings and take credit from the same banks with the same huge interests. Al these led to the case when majority of the enterprises had such amount of liabilities which exceeded their assets. Majority of these liabilities were debts to commercial banks, other were liabilities on utilities, non-budgetary organizations and waves to employees.
Finally, hundreds of companies were proclaimed as insolvent or liquidated during the privatization processes. The main reasons for such events were management incompetence and lack of experience and wrong macroeconomic policy of the government.
As it was mentioned before, first law on enterprises insolvency was not efficient enough, and only after the changes in 2006, when rehabilitation procedures were improved some visible positive changes became noticeable. Table 2 illustrates information on the dynamics of Kazakh’s enterprises insolvency on the period from 2007 to 2012. In order to fulfill goals of the work sample of 30 different non-financial enterprises which are publicly traded on Kazakhstan Stock Exchange (KASE) [11] was selected. These companies represent industrial (53,33 %), manufacturing (13,33 %), construction (13,33 %), agricultural (10 %) and transportation (10 %) companies.
Among those companies 6 are bankrupt, and the rest 24 for are operating entities. For the selected sample financial reports on the periods from 2006 to 2013 were used. Figure illustrates the division of investigated enterprises by industries. Furthermore, 5 models of three different classes were chosen: David Durand Model [6], Altman – Z Score [1], Altman – Z′China Score [3], Ohlson Model [11] and Z″ – Score Model for Japan [7].
Table 2
Dynamics of Kazakhstan’s enterprises insolvency [10]
|
Yeas |
2007 |
2008 |
2009 |
2010 |
2011 |
2012 |
|
Amount of enterprises |
2507 |
2638 |
2627 |
2817 |
1971 |
1939 |
Note. Calculated based on data from the National Statistic agency of RK.
First multivariate model was presented by Altman in 1968 [1] who used multivariate discriminant analysis (MDA) to develop a five-factor model in order to predict bankruptcy for manufacturing firms. MDA computes the discriminant coefficients and selects the appropriate weights (cut-off score) which will separate the average values of each group, while minimizing the statistical distance of each observation and its own group means:
Z = 1,2X1 + 1,4X2 + 3,3X3 + 0,6X4 + 1,0X5. (1)
Later, model was adopted and calibrated by economists for various countries [3, 7]:
Z′China = 0,517 – 0,460X1 + + 9,320X2 + 0,388X3 + 1,158X4; (2)
Z″Japan = –0,833 + 0,388X1 + + 1,158X2 + 9,320X6 – 0,460X7. (3)
Ohlson used statistics of 2000 companies, from which 135 were bankrupt, bigger amount of investigated companies makes results of the model more accurate [11]:
O = –1,32 – 0,407X8 + 6,03X7 – 1,43X1 + + 0,0757X9 – 1,72X10 – 2,37X6 – – 1,83X11 + 0,285X12 – 0,521X13. (4)
After those nine coefficients are calculated model works with almost the same logic as Altman Z-score, and all unknown variable in the formula (3) are substituted with the results. Obtained value of the O-score itself does not represent the probability of the insolvency, but may be transformed into probability using following formula:
 (5)
(5)
These models represent three different classes of insolvency risk prediction models: naïve, discriminant analysis and logit-probit models. Table 3 demonstrates the frequency analysis of the ratios used in the research. Moreover, it describes X-coefficients used in models for risk assessment. In both cases, after final values of Z or O scores are calculated, those values are evaluated on the fixed scales and the company is identified as bankrupt or stable.
Empirical analysis and results verification
Table 4 represents the fragment of the enterprises’ classifications according to the assessment models results according to 5 different models; moreover actual state of the enterprises’ is shown.
After all calculations and evaluations were performed authors calculated errors and the accuracy of the models applied. Accuracy test was performed on the same logic as in Altman’s work [4], where the verification of the classification was based on the investigation of the 2 types of errors: Error 1 – According to the assessment results enterprise is defined as solvent, but in fact this company is insolvent; Error 2 – According to the assessment results enterprise is classified as insolvent, but in fact it is financially stable and solvent entity.
Finally, when all models were applied to the investigated companies accuracy test was performed. Results of the accuracy test are introduced in the Table 5.
Table 3
Ratios frequency analysis
|
Ratios |
Z |
Z′ |
Z″ |
Oo |
Dd |
SUM |
|
Working capital / total assets (X1) |
+ |
+ |
+ |
+ |
4 |
|
|
Retained Earnings / Total Assets (X2) |
+ |
+ |
+ |
3 |
||
|
Earnings Before Interest and Taxes / Total Assets (X3) |
+ |
+ |
2 |
|||
|
Market Value of Equity / Book Value of Total Liabilities (X4) |
+ |
+ |
2 |
|||
|
Sales / Total Assets (X5) |
+ |
+ |
2 |
|||
|
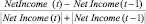
Net income / total assets (X6) |
+ |
+ |
2 |
|||
|
Total liabilities / total assets (X7) |
+ |
+ |
2 |
|||
|
LOG (total assets / GNP price‐level index) (X8) |
+ |
1 |
||||
|
Current liabilities / current assets (X9) |
+ |
1 |
||||
|
One if total liabilities exceeds total assets, zero otherwise (X10) |
+ |
1 |
||||
|
Funds provided by operations / total liabilities (X11) |
+ |
1 |
||||
|
One if net income negative for the last two years, zero otherwise (X12) |
+ |
1 |
||||
|
|
+ |
1 |
||||
|
NPAT / Average assets (X14) |
+ |
1 |
||||
|
Current Assets / Current Liabilities (X15) |
+ |
1 |
||||
|
OE / total assets (X16) |
+ |
1 |
 (X13)
(X13)
Note: Z – Altman Z-Score; Z′ – Altman Z for China; Z″ – Altman Z for Japan; Oo – Ohlson O-Score; Dd – David Durand model.
Table 4
Fragment of insolvency assessment models calculations
|
Enterprise |
Model |
Real state of the firm |
Assessment result |
||||||||
|
Z |
Z′ |
Z″ |
Oo |
Dd |
F |
P_Z |
P_Z′ |
P_Z″ |
P_ Oo |
P_Dd |
|
|
1 |
1,48 |
0,18 |
–0,60 |
1,00 |
26,24 |
B |
B |
B |
N |
B |
B |
|
2 |
1,21 |
0,30 |
–0,81 |
1,00 |
0,00 |
B |
B |
B |
N |
B |
B |
|
3 |
0,94 |
0,20 |
–0,15 |
1,00 |
39,02 |
B |
B |
B |
N |
B |
N |
|
4 |
1,12 |
0,19 |
–0,56 |
1,00 |
18,74 |
B |
B |
B |
N |
B |
B |
|
5 |
0,48 |
1,83 |
–1,54 |
0,93 |
0,00 |
B |
B |
N |
B |
B |
B |
|
6 |
–1,59 |
–4,10 |
–2,04 |
0,71 |
0,00 |
B |
B |
B |
B |
B |
B |
|
<…> |
|||||||||||
|
25 |
3,61 |
0,79 |
0,21 |
1,00 |
79,91 |
N |
N |
N |
N |
B |
N |
|
26 |
1,21 |
0,16 |
–0,73 |
1,00 |
8,15 |
N |
B |
B |
N |
B |
B |
|
27 |
0,46 |
–1,13 |
–1,55 |
0,99 |
7,35 |
N |
B |
B |
B |
B |
B |
|
28 |
2,92 |
1,17 |
–0,47 |
1,00 |
35,59 |
N |
N |
N |
N |
B |
N |
|
29 |
0,02 |
0,29 |
–1,30 |
1,00 |
8,97 |
N |
B |
B |
B |
B |
B |
|
30 |
7,90 |
–1,37 |
1,38 |
1,00 |
65,21 |
N |
N |
B |
N |
B |
N |
Note. Constructed based on calculation made by authors.
Table 5
Results of the models verification
|
Model |
Real state of the enterprise |
Amount of correct assessments |
Accuracy, % |
Amount of misclassifications |
Error, % |
Total forecasts |
|
Z |
B |
6 |
100 |
0 |
0 |
6 |
|
N |
16 |
66,67 |
8 |
33,33 |
24 |
|
|
Total |
22 |
73,33 |
8 |
26,67 |
30 |
|
|
Z′ |
B |
5 |
83,33 |
1 |
16,67 |
6 |
|
N |
10 |
41,67 |
14 |
58,33 |
24 |
|
|
Total |
15 |
50 |
15 |
50 |
30 |
|
|
Z″ |
B |
2 |
33,33 |
4 |
66,67 |
6 |
|
N |
22 |
91,67 |
2 |
8,33 |
24 |
|
|
Total |
24 |
80 |
6 |
20 |
30 |
|
|
Oo |
B |
6 |
100 |
0 |
0 |
6 |
|
N |
0 |
0 |
24 |
100 |
24 |
|
|
Total |
6 |
20 |
24 |
80 |
30 |
|
|
Dd |
B |
3 |
50 |
3 |
50 |
6 |
|
N |
24 |
100 |
0 |
0 |
24 |
|
|
Total |
27 |
90 |
3 |
10 |
30 |
Note. Calculated by author based on the investigation results.
According to the analysis original Altman Z-Score is most accurate in the classification of bankrupt companies, as it shows 100 % of accuracy in the identification of insolvent companies. The overall accuracy of the model is 73,33 %. Nevertheless, David Durand model is 90 % accurate. Altman Z″ – Score for Japan obtained 80 % accuracy. Minimal accuracy was demonstrated by original Altman Z″ – China – 50 %.
Conclusion
Among five applied models Ohlson O-Score has the lowest accuracy and seems to be completely inapplicable in Kazakhstan. The reason for that is different balances sheet structure and value of weighted coefficients. What is about Altman Z-Score models it can be said that this model have to be adjusted for Kazakhstan, as well as David Durand method. As it was concluded by many researches all countries require its own assessment models. Results of the investigation prove that all models should be adapted to the specific conditions of each countries’ financial and economic standards and norms for the most accurate and effective application.
Библиографическая ссылка
Voronova I.S., Amangeldy S. ASSESSMENT OF THE INSOLVENCY RISK FOR NON-FINANCAL ENTERPRISES: CASE OF KAZAKHSTAN // Международный журнал экспериментального образования. 2015. № 12-6. С. 719-723;URL: https://expeducation.ru/ru/article/view?id=9322 (дата обращения: 15.06.2026).